2022. 1. 12. 07:27 ㆍ개발 이야기/오픈소스
MSA! Micro-service architecture is now an architecture that cannot be left out when developing and operating services. Suitable for fast deployment, flexible operation, and large-scale service, MSA has a somewhat complex structure for servers as the existing monolithic architecture has been broken down into small service units and containerized. An orchestration open source has been developed that easily manages this complex structure, and among them, Kubernetes is becoming a global standard for container management. However, managing this complex structure, the observability field, which monitors the resource usage of numerous services, is also being developed quite actively and many services are being produced.

I think Prometheus and Grafana are the most famous open sources in the field of Observability. Of course, many powerful tools such as superset are being developed, but there seems to be an overwhelming number of places where Prometheus and Grafana are being used. Using Grafana, which is too powerful to be called an open source, you can easily and quickly create useful data into various charts, so familiar users can create it like Like an expensive monitoring product in tens of minutes.

However, MSA continues to develop and the backend consists of a more complex architecture. In the case of Kubernetes clusters, they use multiple clusters rather than one cluster, and they also manage a mixture of Kubernetes and Non-Kubernetes environments.
In this case, if you configure with Promethus, you will have to install Prometheus in each environment and open a port in each environment separately to link it with Grafana or service Grafana in each environment.

In case of this, Prometheus provides remote write function. However, Prometheus has not designed and developed these functions since its initial development, so even if the remote write function is used, the time series is written on the WAL(Write Ahead Log) and sent to the remote write as an endpoint, which has a lot of impact on memory use.


For this reason, the method of collecting and managing data in one backend using Prometheus' remote write with the architecture shown in the figure below is not widely used.

However, as mentioned above, MSA developed applications are now being serviced in various and complex environments such as the Kubernetes environment, the Non-Kubernetes environment, and the IaaS environment, and Observability in this field is expected to pioneer into a new market.
Alternatively, Clymene, developed as an architecture that collects time series data from various environments, can provide observability by collecting time series data from multiple complex and various environments and systems in one place.

Clymene is an open source developed based on Prometheus' time series data collection method and the architecture of the Jaegertracing project, an open source of service tracing in a distributed environment. Prometheus' Service Discovery features make it easy to find endpoints that can collect time series data from multiple environments, and can be configured with a powerful high-availability (HA) architecture using Jaeger's backend structure.

Clymene-Agent, which is responsible for collecting time series data, has Prometheus' Service Discovery function, and is developed in a structure suitable for agents(WAL unused, scrap only) when collecting and transmitting time series data, so its resource usage is relatively low compared to Prometheus' Remote Write function.
Windows exporter scrape to collect rule, apply the performance I'll check.
Clymene Agent's scape rule
global:
  scrape_interval: 15s # Set the scrape interval to every 15 seconds. Default is every 1 minute.
  evaluation_interval: 15s # Evaluate rules every 15 seconds. The default is every 1 minute.

scrape_configs:
  - job_name: 'clymene_windows_exporter'
    static_configs:
      - targets: [ 'localhost:9182' ]
Prometheus's Remote write rule(using 8080 port)
global:
  scrape_interval: 15s # Set the scrape interval to every 15 seconds. Default is every 1 minute.
  evaluation_interval: 15s # Evaluate rules every 15 seconds. The default is every 1 minute.

remote_write:
  - url: "http://localhost:9090/api/v1/write"

scrape_configs:
  - job_name: "windows_exporter"
    static_configs:
      - targets: ["localhost:9182"]
Prometheus rule for storing data(Comparison of Clymene_agent, remote_prometheus for performance analysis)(Using 9090 port)
global:
  scrape_interval: 15s # Set the scrape interval to every 15 seconds. Default is every 1 minute.
  evaluation_interval: 15s # Evaluate rules every 15 seconds. The default is every 1 minute.

scrape_configs:
  # The job name is added as a label `job=<job_name>` to any timeseries scraped from this config.
  - job_name: "clymene_agent"
    static_configs:
      - targets: ["localhost:15691"]

  - job_name: "prometheus_remote_writer"
    static_configs:
      - targets: ["localhost:8080"]
When you check the UI of the storage Prometheus, you can see that Windows_exporter time series data transmitted by Prometheus and Clymene are being stored normally.

Now, let's compare the performance of each agent.
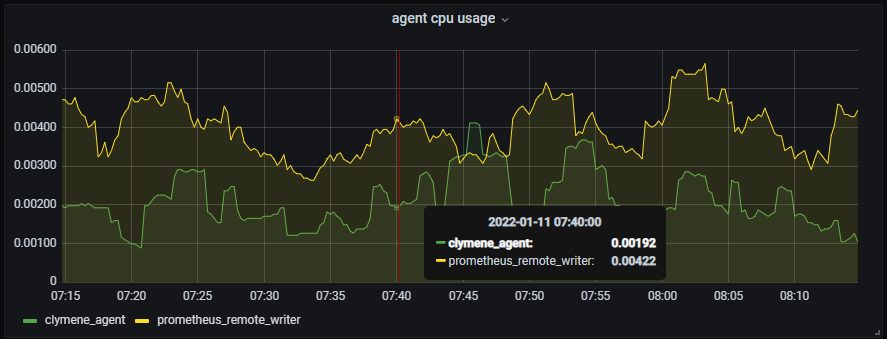
1. cpu Usage- Prometheus does not use much cpu, but it can be seen that the Clymene agent shows a smaller cpu usage.

2. Resident memory byte - In the case of resident memory usage, Clymene and Prometheus show many performance differences.

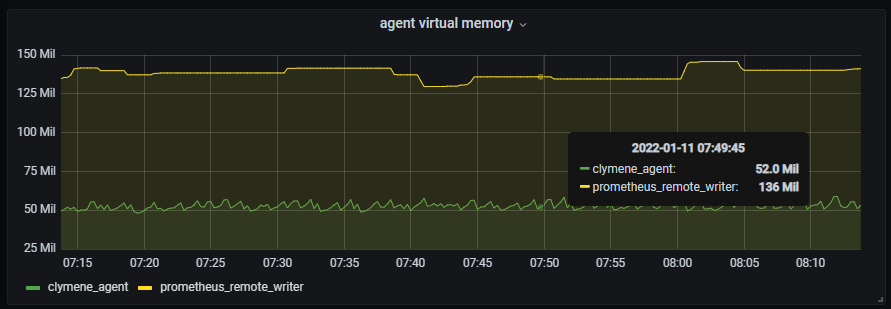
3. Virtual memory byte - Even in the case of virtual memory usage, Clymene and Prometheus show significant performance differences.

It is not the problem of Prometheus that this result occurs, but the problem of the development concept. Perhaps the difference in performance between Clymene-agent and Prometheus' remote write, designed as agents from the beginning of the design, showing low resource usage, is a natural result.
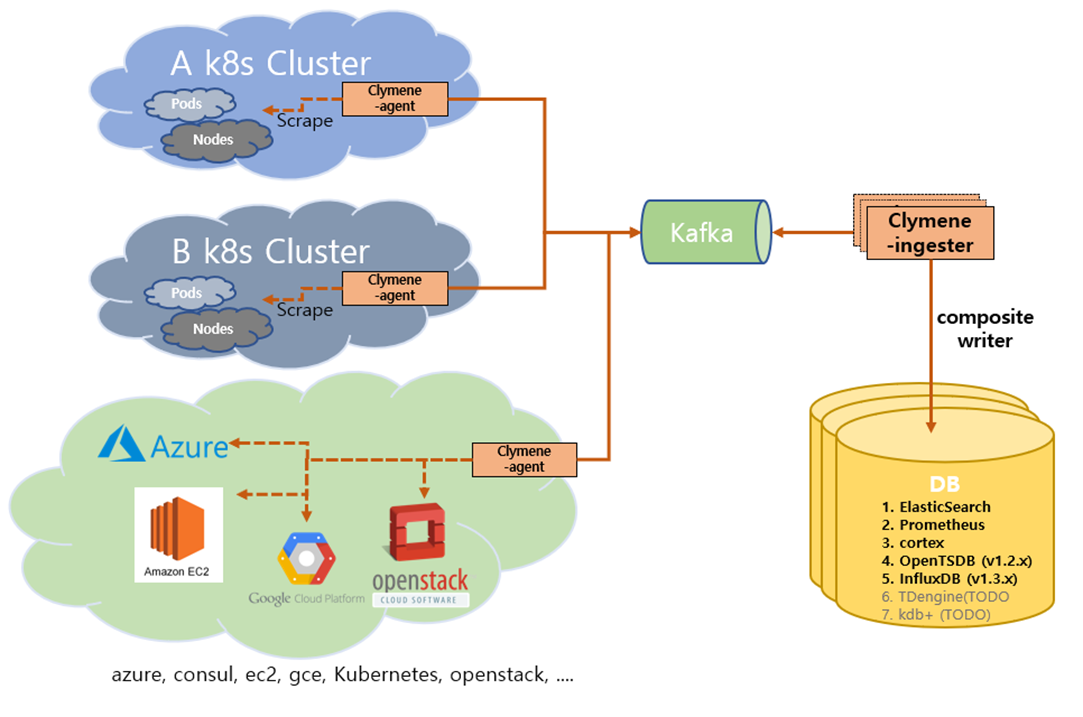
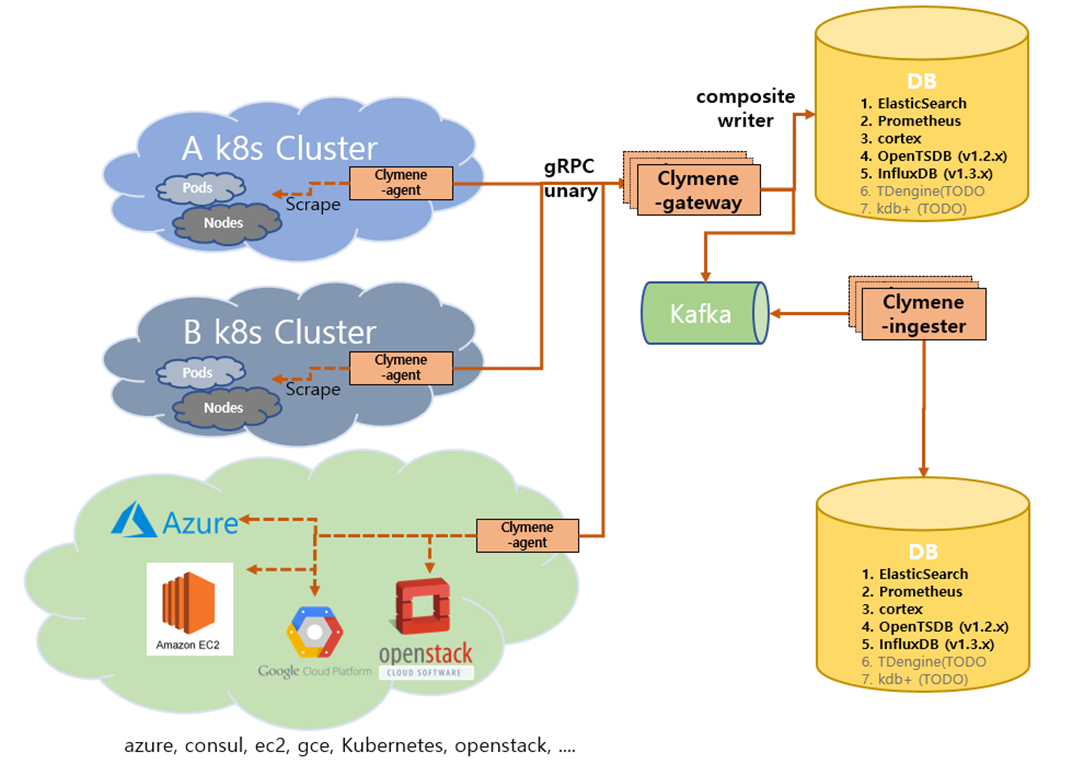
In addition, components called ingester and gateway exist in Clymene. You can also use Kafka using these components, and you can use gRPC to receive time series data. It can also store the same data in a database in various farms with the composite write function.
Architecture using Clymene-ingester and kafka

Architecture using Clyme-gateway and ingester

So far, we have learned how to efficiently collect and manage time series data in various environments in one place using Clymene open source. Only your interest can develop the Clymene-Project. Please show a lot of interest.
Please, Give it a star at GitHub!
Thank you,
https://github.com/Clymene-project/Clymene
GitHub - Clymene-project/Clymene: the Clymene is a time-series data collection platform for distributed systems.
the Clymene is a time-series data collection platform for distributed systems. - GitHub - Clymene-project/Clymene: the Clymene is a time-series data collection platform for distributed systems.
github.com
'개발 이야기 > 오픈소스' 카테고리의 다른 글
| # 오픈소스를 이용한 다중 k8s 클러스터 환경의 모니터링 시스템 구축 (0) | 2022.08.03 |
|---|---|
| # 오픈소스 OpenTracing - Zipkin (0) | 2022.03.20 |
| #[Clymene] 분산 환경의 효율적인 시계열 데이터 수집 및 관리 방안 (0) | 2022.01.11 |
| # gRPC - gogoproto extension 사용하기 (1) | 2021.05.30 |
| # gRPC 개요 및 proto 파일 정의 (0) | 2021.05.30 |